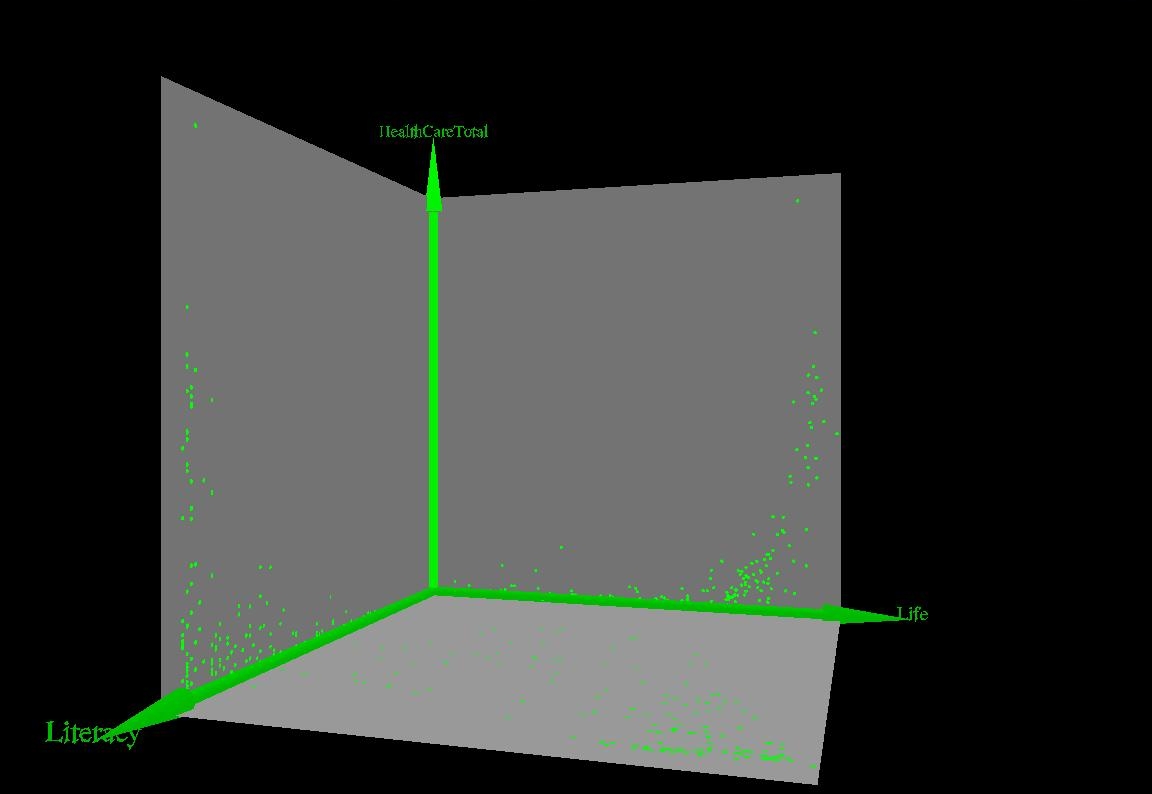
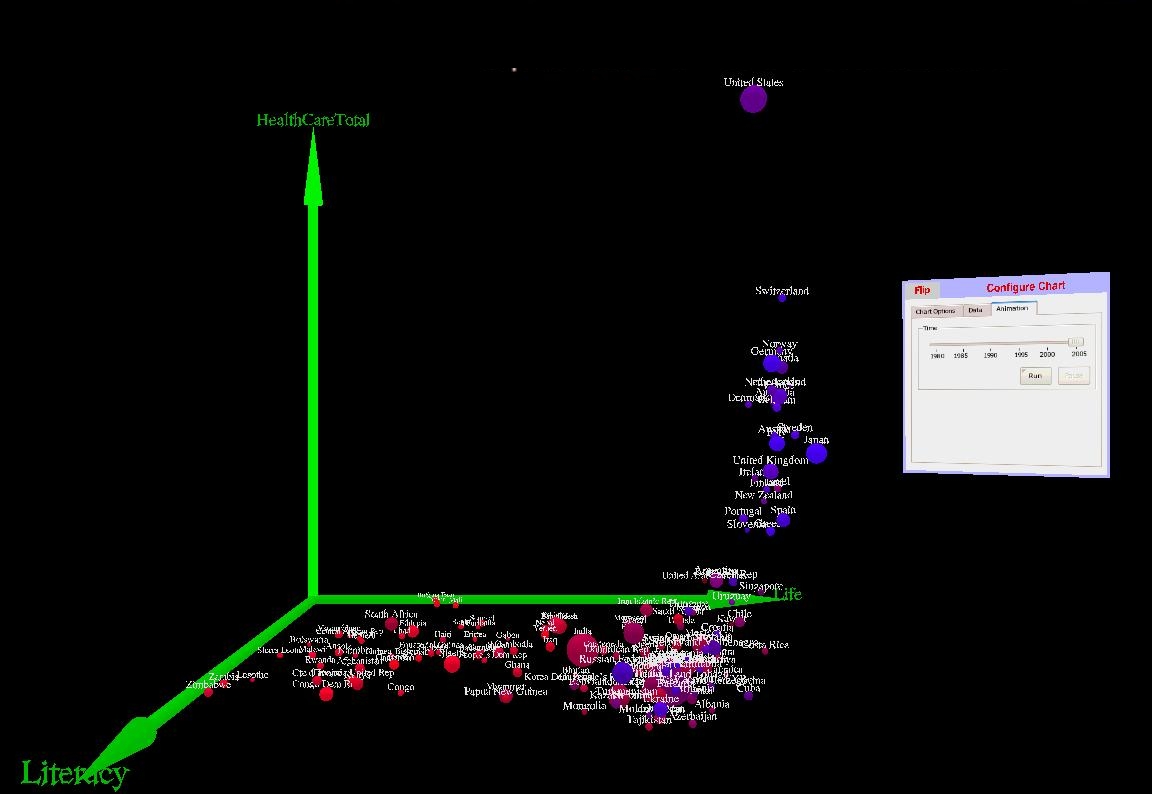
This application proposes a method for visualizing multi-dimensional numerical data. The case study uses data provided by the UN. This data includes health care, life duration expectancy and literacy rate over a 25 year period in some countries. The population size and the age groups of every country are also provided. Researchers usually find it very difficult and time consuming to analyze all these numbers. Even if these numbers are converted to 2D charts, still many charts need to be produced and compared versus each other.

2D representation is still not informative enough.
The current application provides different 3D methods to visualize this data. It also makes use of the CAVE system to add more insight to these methods since it is proven that human beings perceive 3D data better than comparing different 2D ones. First, the health care percentage, life time span of the population and the percentage of literacy are mapped to three spatial axes. Every country is represented by a floating sphere, each of which has a position with respect to these axes. The population is mapped to the radii of the spheres; large spheres represent countries with relatively large population and the vice versa. At the same time, the age groups are mapped to the color of the spheres, where the blue color represents higher percentage of old people while and the red color represents higher percentage of young people. Finally, the time factor is represented by the animation of the countries over the given 25 years. This animation represents the gradual change of life expectancy, health care and the literacy rate . A cutting plane is also used to focus on a certain country.

The proposed methods facilitate the analysis of data enormously. Using this application, various information can be grasped from the first glance. It is noticeable that most countries are moving forwards, except for some countries in Africa due to HIV, and in Iraq due to the on-going war. The application also shows some interesting insights; although United States of America spends a lot of money on health care, there are other less-developed countries that have higher life expectancy rates . This leads the to the conclusion that better polices are used in these countries than the ones used in the USA.